Faster vegetation management for safer, more fire-resilient landscapes
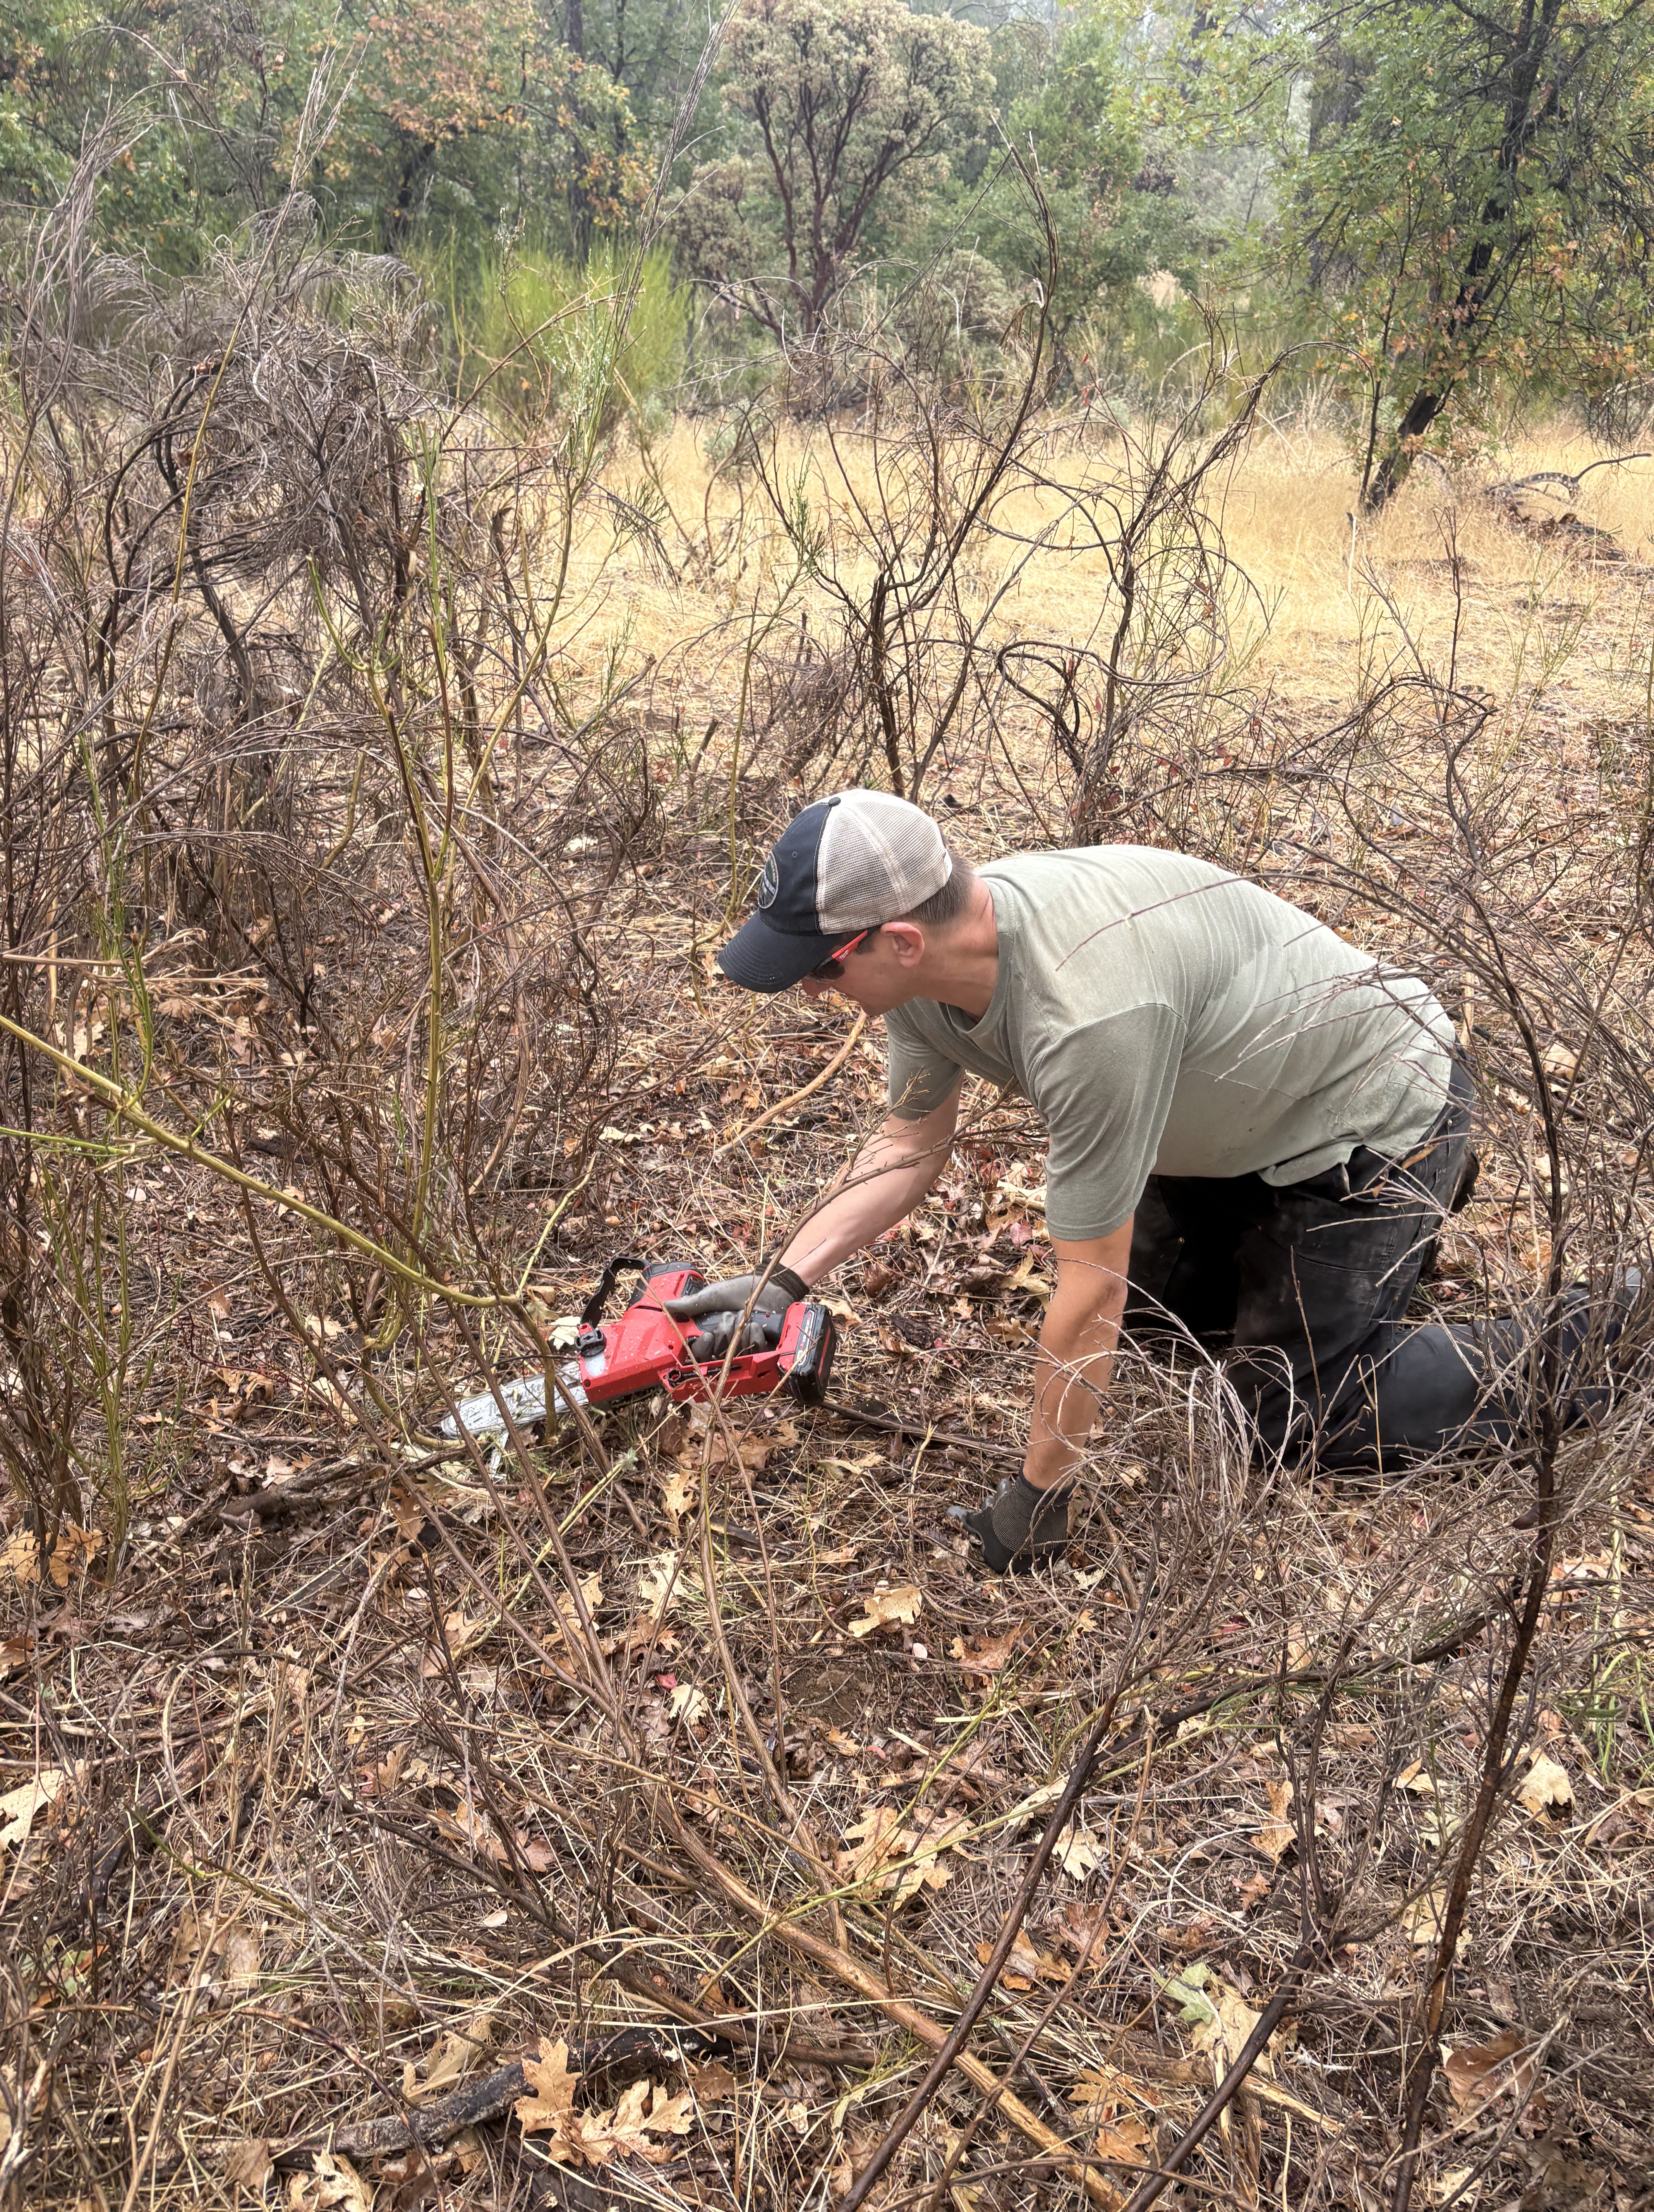
When it comes to reducing wildfire risk, the work that matters most is often the work that takes the longest: cutting back invasive brush, clearing ladder fuels, and keeping shaded fuel breaks and defensible space maintained. The SlashMaster chainsaw adapter is designed to help crews and volunteers move faster, work safer, and cover more ground—without changing the saw you already own.
Why SlashMaster
SlashMaster holds branches and brush in place, so you can stabilize the material and make clean cuts with one hand. That means less repositioning, less wrestling with springy vegetation, and more efficient cutting—especially in dense, tangled fuels like broom and brush piles.
Benefits at a glance
- Holds branches in place so you can cut more easily with one hand
- Cuts faster than a chainsaw alone (no adapter)
- Safe and easy to use for field conditions and volunteer settings
- Fits any size chainsaw (adapter-compatible across saw sizes)
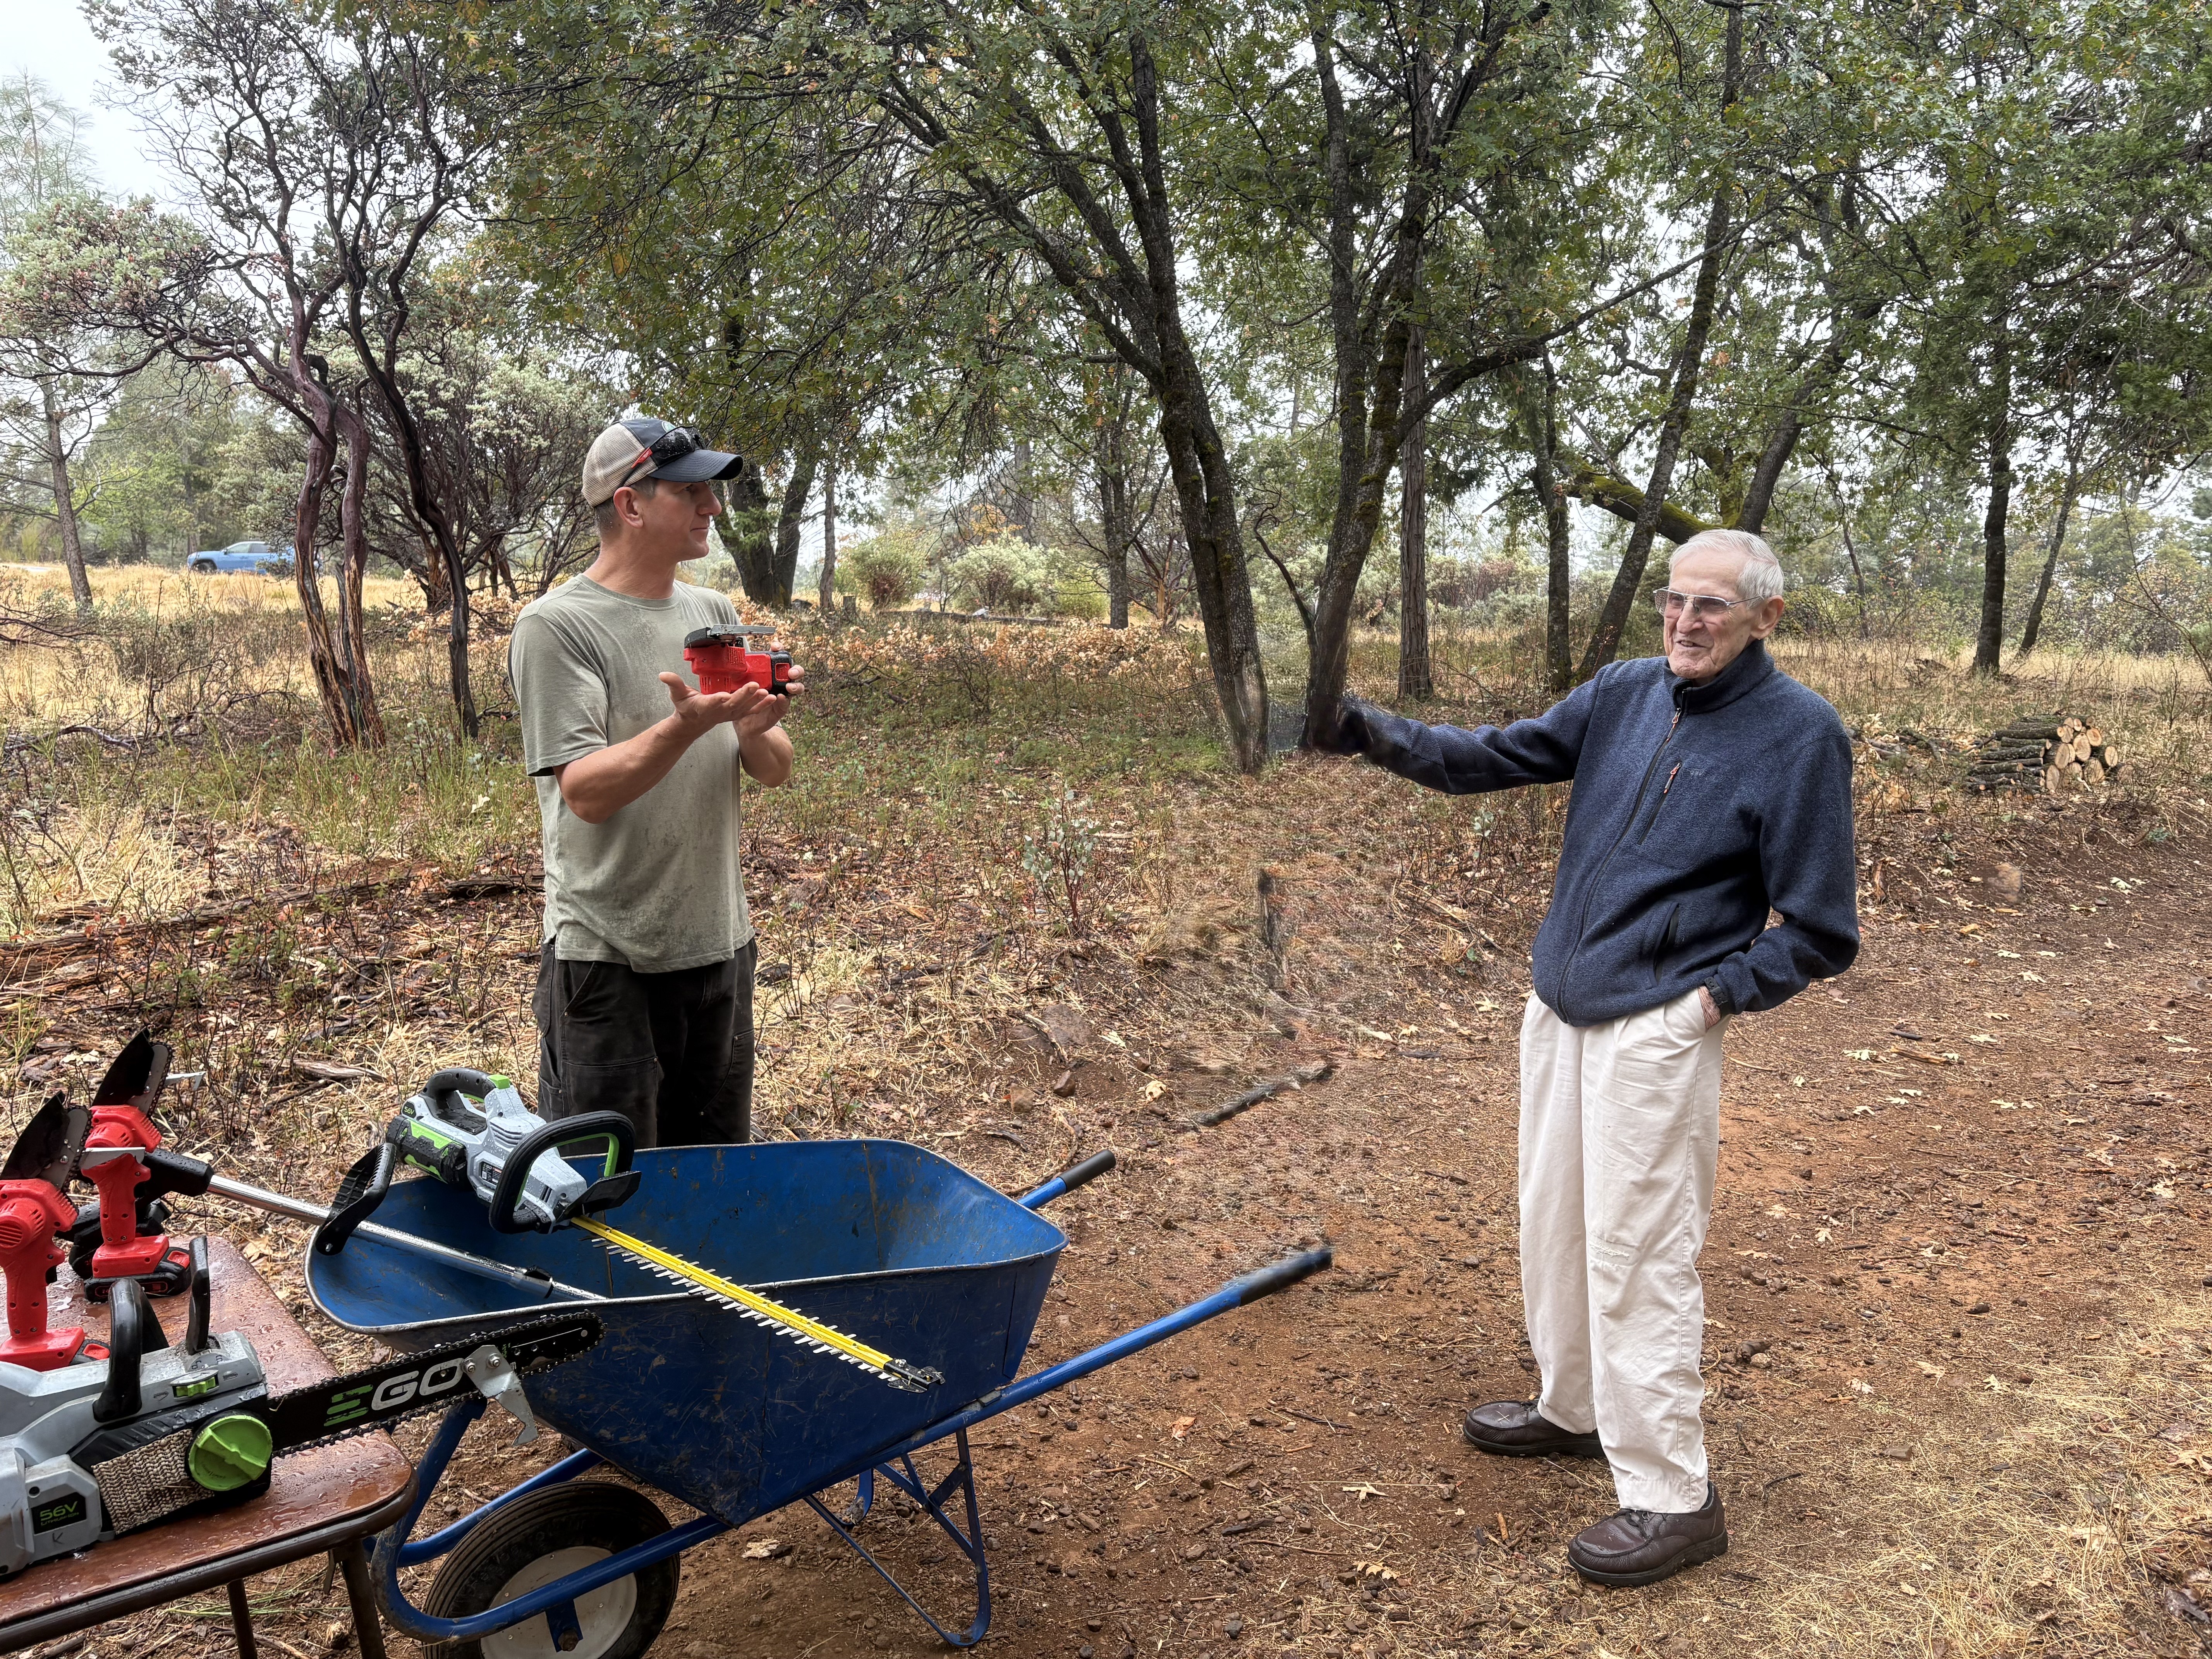
Proven in the field
“We used the chainsaw adapters Art created at a volunteer work party and it made cutting down the broom go much quicker. We were able to cover much more ground using the ‘magic’ saw. The volunteers had fun putting the new equipment to the test and they agreed it does improve the speed and efficiency of eliminating Scotch broom. More than one volunteer wanted to purchase the adapter to make their saw a ‘magic’ saw. Bear Yuba Land Trust will be using these adapters in the future to help with our stewardship efforts.”
— Shaun Clarke, Public Recreation Stewardship Manager, Bear Yuba Land Trust
Make your saw a “magic” saw
If your work includes invasive species removal, roadside and utility corridor clearance, fuel reduction projects, or stewardship days, SlashMaster is a simple upgrade that can help you get more done with the time, budget, and hands you have.
Contact
Contact Art Krugler at artkrugler@gmail.comto learn more about the SlashMaster.


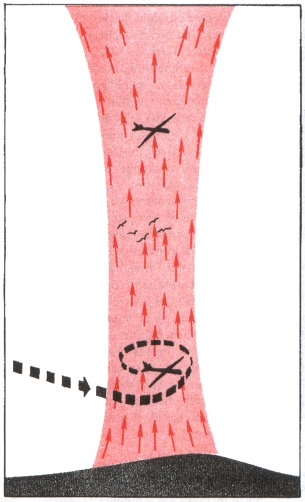 Embed the ‘slender waist’ feature of Figure 147 in your mind; it is a very important feature.